Key Questions
- Who are the special populations of gifted students?
- How do we identify special populations?
There are two competing views regarding the bias in standardized testing. The first contends that there is little or no evidence of bias in the most well-constructed tests of intelligence. The other view asserts that factors such as low socioeconomic status (SES) and differences in social and cultural heritage, in communicative behaviors, and in language contribute to test bias. Since testing of IQ and achievement continue to be part of identification processes, it’s important to look at the issue of test bias.
Print a list of Test Bias As A Barrier To Identification Items. ![]()
IQ is a measure of relative intelligence determined by a standardized test. So, the first question raised in the debate of test bias is what factors make up intelligence. The first intelligence test was created in 1905 to determine which French school children were too “slow” to benefit from regular instruction. Binet came up with the idea of mental age when he noticed that children are increasingly able to learn difficult concepts and perform difficult tasks as they get older. Most children reach the same level of complexity at about the same time, but some children are slower at reaching those levels. A 6-year-old child who can do no more than a 3-year-old has a mental age of 3. Wilhelm Stern divided the mental age by the chronological age to get a “Mental Quotient.” Mental Age divided by Chronological Age = Mental Quotient.
Any time we talk about testing it’s important that we are all operating with the same understanding of testing terminology. Click on each tab for more information on each term.
- Standardization
- Norming
- Construct
- Reliability
- Validity
- Standard Error of Measurement
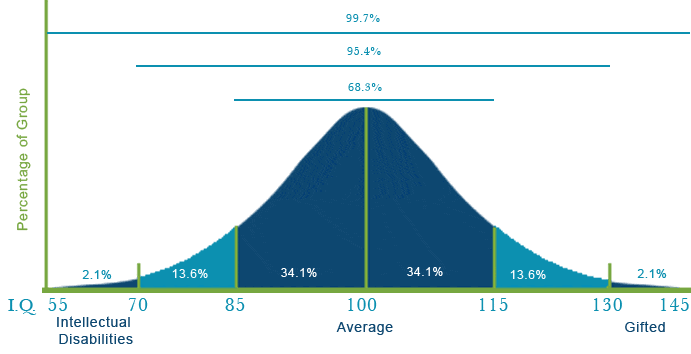
A 6-year-old able to do what an average 9-year-old can do has a Mental Quotient of 1.5 or (9 divided by 6). Lewis Terman later multiplied the Mental Quotient by 100 to remove the fraction and the Intelligence Quotient (IQ) was born! Mental Age divided by Chronological Age X 100 = Intelligence Quotient. The 6-year-old with the Mental Quotient of 1.5 has an IQ of 150. The majority of people have an IQ between 85 and 115. Here’s how we know that. After giving a particular test (like the Stanford-Binet, or (Weschler Intelligence Scale for Children (WISC)) to thousands of individuals (representing a proportionate number of the population), plotting their scores on a vertical and horizontal axis forms a bell curve (see graph below) of normal distribution of scores, with the greatest number of plots falling within one standard deviation (15 pts.) on either side of the mean (100).
In the state of Florida, IQ is one of several criteria used to determine eligibility. The IQ criterion for gifted eligibility is two standard deviations (30 points) above the mean, or 130 IQ on a standardized individual test of intelligence. You can see from the diagram below that statistically we can predict that 2.1% of the students tested will score at or above 130 on the test. A closer look at the 2.1% is where we find that they are mostly white, mostly from middle/upper socioeconomic status families. The ELL student is not anywhere on the plot since the tests are not normed for languages other than English. The opposite is true on the other side of the mean of 100. Here we find mostly minority and Lower SES families. With this knowledge, you must make a decision. Do you believe that standardized IQ tests capture the true construct of intelligence? Do you believe that Lower SES students and minorities are born less bright than their white middle/upper class peers?

The test bias debate goes on. However, the real key is to recognize that standardized tests are not infallible measures of gifted potential. Tests just don’t provide all the information needed to make decisions about gifted potential for exceptional performance.
Teachers are in the best position to provide significant information about students that is not available through tests. That is the very reason that procedures used to identify gifted students have changed from a focus on a single intelligence test score to the current focus on multiple methods and instruments. Prior to the 1950s, identification of gifted children was based almost totally on test scores. By 1985, 32 states used a variety of procedures and instruments, but still included IQ and achievement testing. Required cutoff scores on IQ tests ranged from 120 to two standard deviations above the mean (130). Procedures other than IQ tests include both qualitative and quantitative instruments, rating scales, checklists, critical thinking tests, creativity tests, achievement tests, self-concept inventories, and product samples.
All states use some form of intelligence and achievement test results in the identification process. Responding to the historic underrepresentation of special populations of gifted being identified, 40 states use different criteria to identify them today. Florida uses Plan B to address this underrepresentation which will be covered in greater detail later in Week 3.
In the article Research Review: Finding Underserved Populations,![]() authors Daniel Resnick and Madeline Goodman write how traditional methods of identifying gifted students do not necessarily work for these underrepresented groups of students. As you read this research review from Northwest Education magazine, pay close attention to guidelines for finding and serving African American students. Think about how these guidelines can be applied to other underrepresented groups, too.
authors Daniel Resnick and Madeline Goodman write how traditional methods of identifying gifted students do not necessarily work for these underrepresented groups of students. As you read this research review from Northwest Education magazine, pay close attention to guidelines for finding and serving African American students. Think about how these guidelines can be applied to other underrepresented groups, too.

